IS 5320 – Hrishabh Kulkarni

Hrishabh Kulkarni – IS 5320

Tag: Summary

  • Summary Post – HW 10

    Summary Post – HW 10


    Time Log — Teams’ Sites

    (Time spent visiting and commenting on other Teams’ sites)

    Date: Mar. 10, 2026 From: 09:05am To: 09:17am
    Date: Mar. 10, 2026 From: 06:10pm To: 06:22pm
    Date: Mar. 11, 2026 From: 10:15am To: 10:27am


    Time Log — Students’ Sites

    (Time spent visiting and commenting on other students’ sites)

    Date: Mar. 10, 2026 From: 10:10am To: 10:21am
    Date: Mar. 10, 2026 From: 07:30pm To: 07:41pm
    Date: Mar. 11, 2026 From: 11:05am To: 11:16am
    Date: Mar. 11, 2026 From: 08:15pm To: 08:26pm


    Essay I — Summary of Content Activities

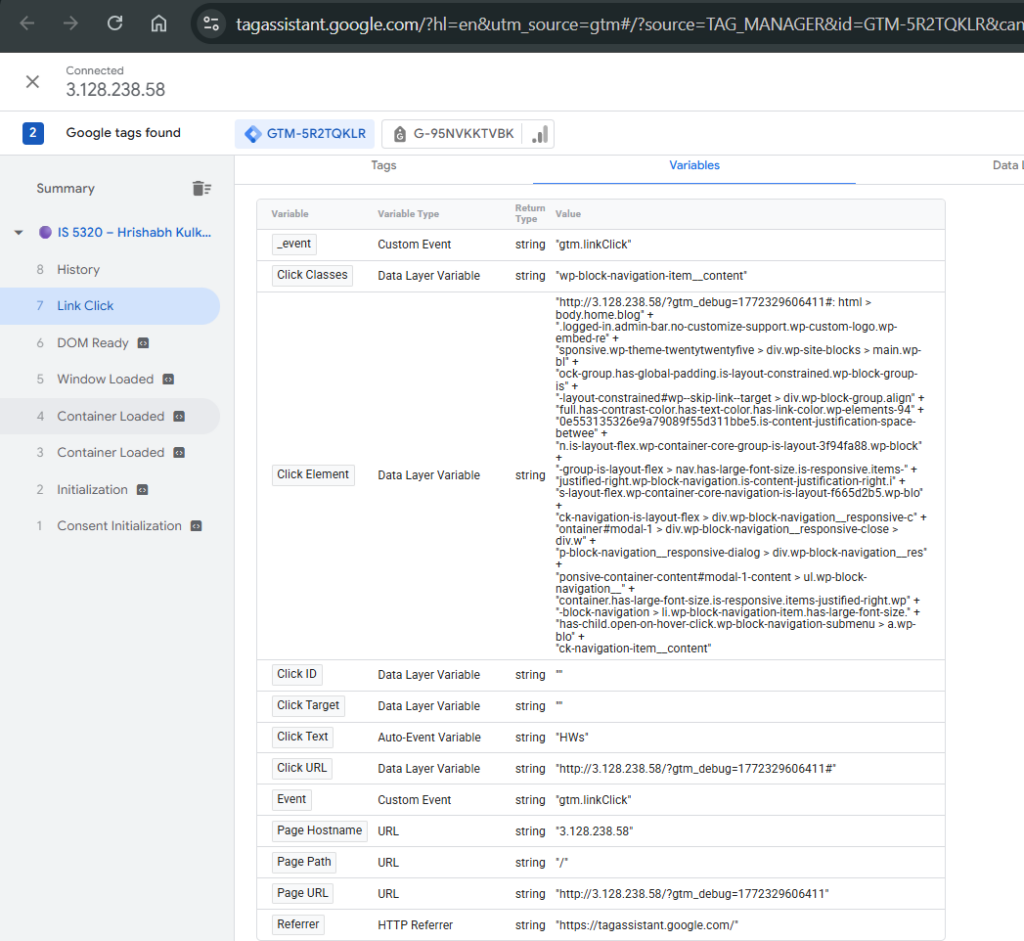
    This week, I created two new blog posts continuing my AI trends series for 2026. The first post covers Context Engineering, exploring how the AI industry is moving beyond simple prompt engineering toward designing the entire information environment an AI system operates in — including memory, live data retrieval, user context, and governance rules. The second post covers AI Governance and Responsible AI, breaking down how landmark regulations like the EU AI Act are reshaping how every AI system gets built, deployed, and audited in 2026. Both posts include properly cited images, are open to visitor comments, and have been assigned relevant categories and tags. I updated the General Menu to reflect both new posts under the AI category and added them to the HW10 section of the HWs Menu for grading purposes. I also visited all Teams’ and students’ sites throughout the week, left thoughtful comments on posts I engaged with, and moderated and approved all incoming comments through the WordPress admin dashboard. Additionally, I monitored my site traffic daily via Google Analytics 4 and connected my GA4 data source to a Looker Studio report to visualize my KPIs.

    New Content Published This Week:


    Essay II — Summary of KPI Table

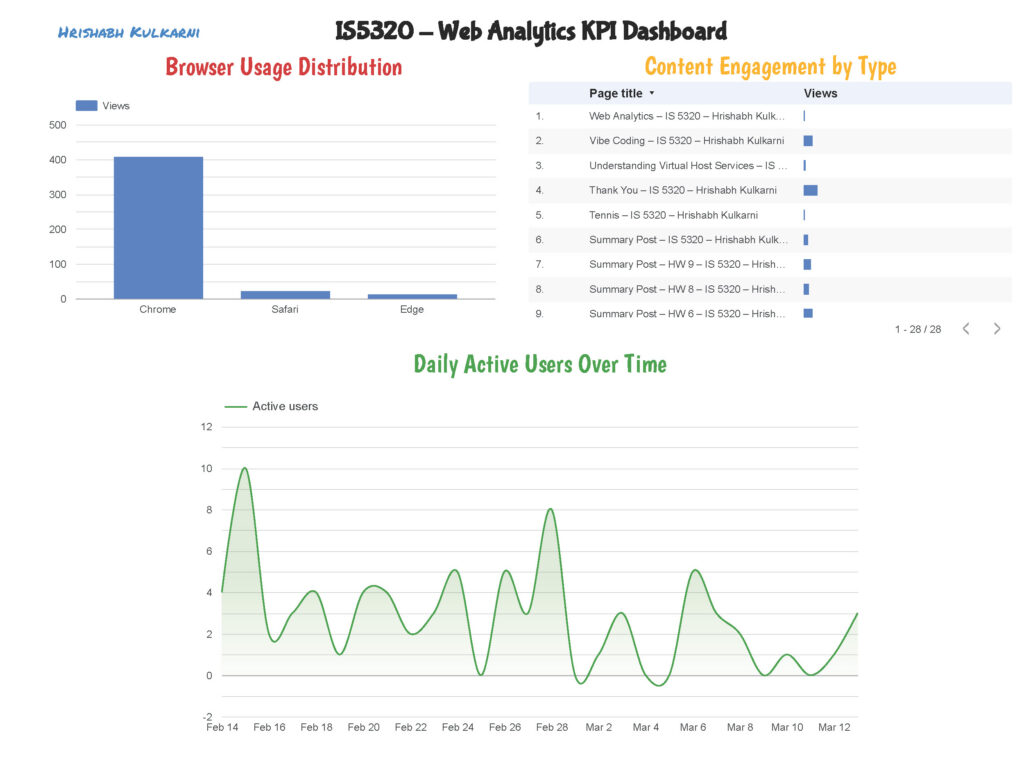
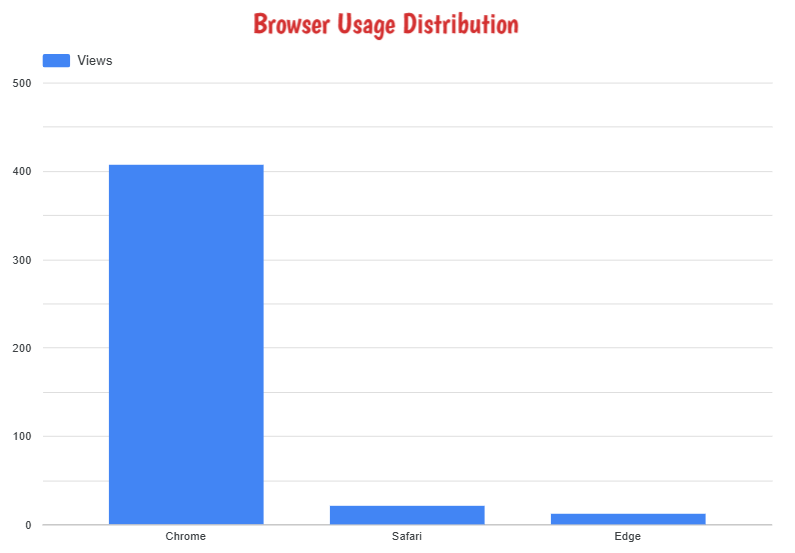
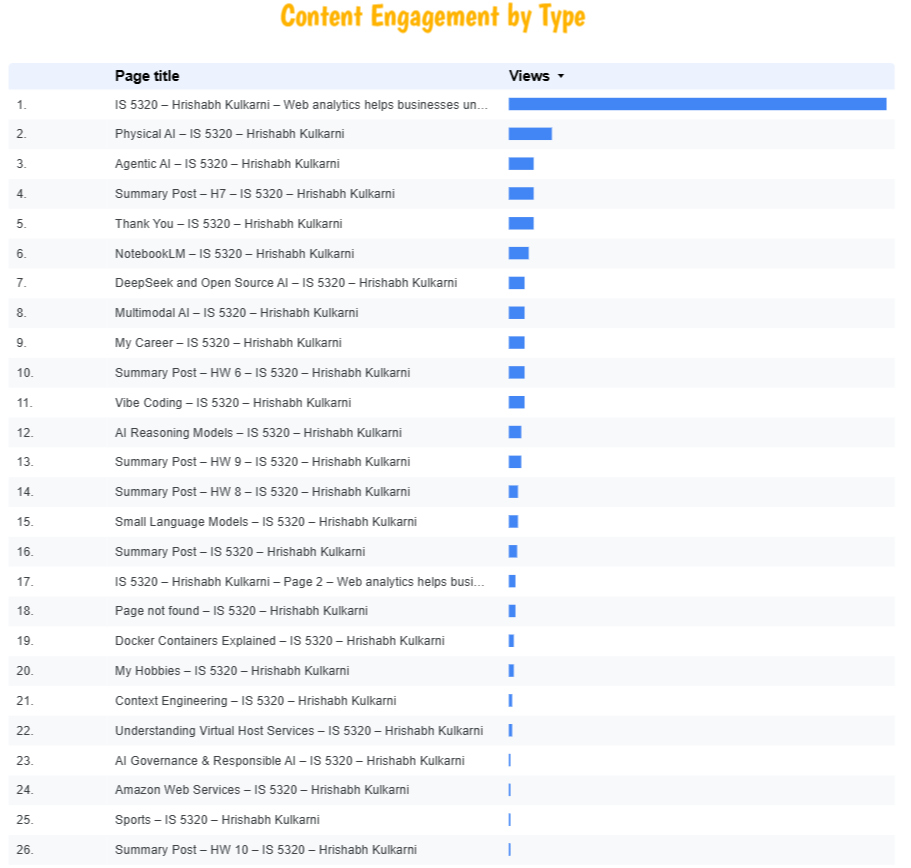
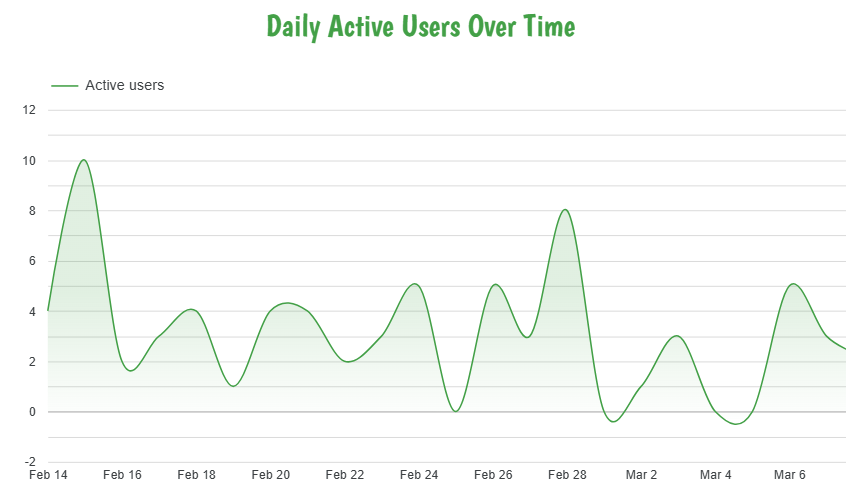
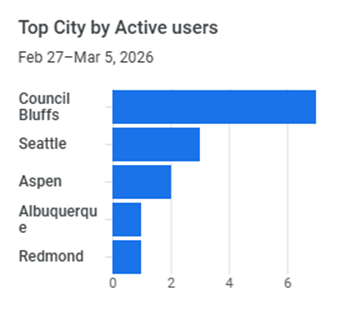
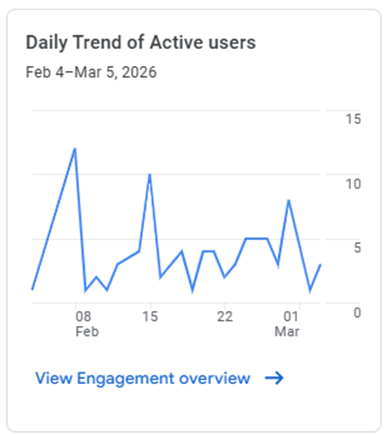
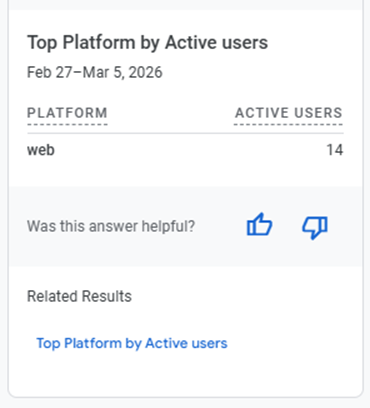
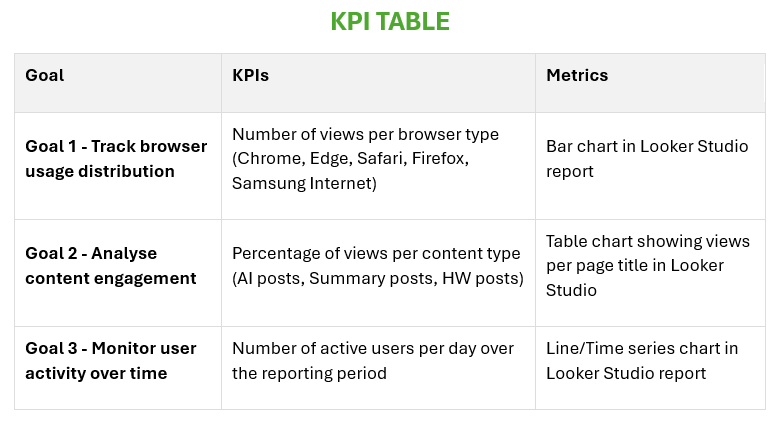
    For this week’s assignment, I developed a KPI table with three clearly defined goals to measure the performance and engagement of my website using Google Analytics 4 data. The first goal focuses on tracking browser usage distribution — measuring how many views are generated by each browser type (Chrome, Edge, Safari, Firefox, and Samsung Internet) — visualized through a bar chart in Looker Studio. The second goal analyzes content engagement by measuring the percentage of views per content type, helping identify which categories of posts resonate most with my audience. The third goal monitors user activity over time by tracking the number of active users per day, visualized through a line chart in Looker Studio to reveal traffic trends and patterns across the week. Together, these three goals provide a comprehensive view of both my audience’s technical behavior and their content preferences, allowing for data-driven decisions on what to publish and how to optimize the site experience going forward.

    KPI Table:

    GoalKPIsMetrics
    Goal 1 – Track browser usage distributionNumber of views per browser type (Chrome, Edge, Safari, Firefox, Samsung Internet)Bar chart in Looker Studio report
    Goal 2 – Analyze content engagementPercentage of views per content typePercentage of views per content type
    Goal 3 – Monitor user activity over timeNumber of active users per dayLine chart in Looker Studio report

    Essay III — Summary of Looker Studio Report

    This week, I connected my Google Analytics 4 property (IS5320) to Google Looker Studio and built a custom report aligned with the three KPIs identified in Part II. For Goal 1, I created a bar chart displaying the number of page views broken down by browser type — the data clearly showed Chrome as the dominant browser among my visitors, followed by Safari and Edge, providing useful insight into which browsers to prioritize for compatibility testing. For Goal 2, I built a scorecard and table visualization showing the percentage of views per content type — AI-related posts consistently drove the highest engagement, confirming that my audience is primarily interested in technology and AI content. For Goal 3, I created a line chart tracking the number of active users per day over the reporting period — the chart revealed noticeable traffic spikes on the days new blog posts were published, demonstrating a direct correlation between content publishing frequency and daily user activity. The completed Looker Studio report has been downloaded as a PDF and submitted separately to Canvas as required.

  • Summary Post – HW 9

    HW9 – Summary Post


    Time Log – Teams’ Sites

    (Time spent visiting and commenting on other Teams’ sites)

    Date: Mar. 03, 2026 From: 06:15pm To: 06:27pm
    Date: Mar. 05, 2026 From: 10:05am To: 10:17am
    Date: Mar. 06, 2026 From: 07:10pm To: 07:21pm


    Time Log – Students’ Sites

    (Time spent visiting and commenting on other students’ sites)

    Date: Mar. 05, 2026 From: 10:15am To: 10:26am
    Date: Mar. 05, 2026 From: 07:30pm To: 07:41pm
    Date: Mar. 06, 2026 From: 10:30am To: 10:42am
    Date: Mar. 06, 2026 From: 06:10pm To: 06:21pm


    Essay I – Summary of Content Activities

    This week, I created two new in-depth blog posts exploring the latest and most impactful trends in artificial intelligence for 2026. The first post covers Vibe Coding, a revolutionary shift in software development where anyone regardless of coding experience, can build fully functional apps simply by describing what they want in plain English, powered by tools like Cursor, GitHub Copilot, and Replit AI. The second post explores Small Language Models (SLMs), explaining how compact AI models like Microsoft’s Phi-4 Mini and Meta’s LLaMA 3.2 are outperforming bloated large models by running directly on devices, delivering faster, cheaper, and more privacy-friendly AI experiences. Both posts include properly cited images, have comments enabled for visitors, and have been assigned relevant categories and tags. I updated the General Menu to reflect both new posts under the AI category and added them to the HW9 section of the HWs Menu for grading purposes. Additionally, I visited all Teams’ and students’ sites throughout the week, leaving thoughtful comments on posts I found engaging, and moderated and approved all incoming comments on my site through the WordPress admin dashboard.

    New Content Published This Week:


    Essay II – Summary of Automated Insights

    This week, I explored the Automated Insights feature in Google Analytics 4, which uses machine learning to automatically detect unusual changes and emerging trends in site data. I accessed automated insights through Method I – the Home section of the GA4 reporting dashboard where the Insights panel displayed automatically generated observations about my site’s traffic patterns. One notable insight flagged by GA4 was an unusual spike in active users during the week, which Analytics Intelligence attributed to increased engagement from new blog post publications. I also explored the Search Bar (Method III) by typing keywords like “traffic” and “sessions” to surface additional suggestions from Analytics Intelligence. The automated insights panel provided a clear, visual summary of what changed, why it might have changed, and how it compared to previous periods — without requiring any manual report configuration. This feature is particularly powerful for monitoring site health passively, as it alerts you to significant changes without you having to check every report manually.

    i) What are top cities by users?

    ii) What’s the Daily Trend Of Active Users?

    iii) What platforms are used the most?


    Essay III – Summary of Custom Insights

    This week, I created a Custom Insight in Google Analytics 4 to monitor a specific KPI relevant to my site’s goals. I navigated to the Insights section in GA4 and selected Method II – Start from Scratch to define my own custom insight rules. I configured the insight with the following parameters: Evaluation Frequency set to Weekly, Segment set to All Users, and the Condition set to trigger when the number of Sessions decreases by more than 20% compared to the previous week. This custom insight is designed to immediately alert me if site traffic drops significantly, an early warning system that allows me to react quickly by publishing new content or reviewing any technical issues on the site. I also enabled the email alert option so that GA4 automatically sends a notification to my email whenever this condition is met. Once saved, the custom insight appeared in the Insights dashboard and will activate as soon as the defined threshold is crossed. Custom insights proved to be a highly valuable tool for turning raw analytics data into actionable, goal-oriented monitoring.

    Alert me when Sessions decrease by more than 20% compared to the previous week

    Custom Insight Created Successfully

  • Summary Post – HW 8

    Summary Post 8


    Time Log Teams – time spent on other Teams’ sites (must have 3 entries or more):
    Date: Feb. 27, 2026 From: 09:05am To: 09:17am
    Date: Feb. 27, 2026 From: 06:10pm To: 06:22pm
    Date: Feb. 28, 2026 From: 10:15am To: 10:27am


    Time Log Students – time spent on other students’ sites (must have 3 entries or more):
    Date: Feb. 27, 2026 From: 10:10am To: 10:21am
    Date: Feb. 27, 2026 From: 07:30pm To: 07:41pm
    Date: Feb. 28, 2026 From: 11:05am To: 11:16am
    Date: Feb. 28, 2026 From: 08:15pm To: 08:26pm

    Essay I – Summary of Content Activities

    This week, I focused on creating two new in-depth blog posts centered on emerging AI trends that are shaping 2026. The first article explores Multimodal AI, breaking down how modern AI systems can simultaneously process text, images, audio, and video — and why this marks a fundamental shift in human-computer interaction. The second article covers AI Reasoning Models, explaining how systems like OpenAI’s o3 use chain-of-thought reasoning to “think before they respond,” and why this represents a paradigm leap beyond traditional language models. Both posts include proper image citations, are open for visitor comments, and have been categorized and tagged appropriately. I also updated the General Menu to reflect the new content under relevant categories, and added both posts to the HW8 section of the HWs Menu for grading purposes and also added Thankyou page and given it a separate parent block in the Menu. Additionally, I visited all Teams’ and students’ sites, leaving thoughtful comments on posts I found engaging, and moderated and approved incoming comments on my own site through the WordPress admin dashboard.

    New Content Published This Week:

    Essay II – Summary of “Thank You” Event Conversion

    This week, I set up a “Thank You” page conversion event in Google Analytics 4 using Google Tag Manager. First, I created a dedicated Thank You page (not a post) in WordPress, which serves as the destination users land on after submitting a contact form. In GA4, I navigated to Admin → Data Display → Conversions and created a new conversion event named thank_you. To ensure the event fires correctly, I followed Conversion II → Method 1 and created a new event tag in Google Tag Manager — configuring it to trigger when a user lands on the Thank You page URL. The GTM tag was published and verified using GTM’s Preview/Tag Assistant mode, which confirmed the event fired successfully on page load. After the standard 12–24 hour delay, the thank_you conversion event appeared in GA4 under Admin → Events and was toggled as a conversion. Screenshots of the GA4 conversion setup and GTM tag configuration are included below.

    Essay III – Summary of “Menu Click” Event Conversion

    To track user engagement with my site’s navigation, I created a “menu click” custom event in Google Tag Manager for one of the links in my main menu. I started by entering GTM Preview mode and clicking the target menu link to identify its Click Text value in the Tag Assistant window. Using this, I configured a new Click Trigger in GTM with the condition set to Click Text → contains → [menu link text], which avoids the complexity of using empty CSS Click Classes. I then created a corresponding GA4 Event Tag in GTM, named menu_click, linked to this trigger and tied to my GA4 Measurement ID. After publishing the GTM container, I verified the tag fired correctly in Preview mode. Following the 12–24 hour propagation window, the menu_click event appeared in GA4 under Reports → Engagement → Events, confirming successful tracking. I also marked it as a conversion in GA4 to monitor navigation-driven engagement going forward. Screenshots of the GTM trigger setup and the GA4 event report are included below.